Chaos Engineering in Azure with Chaos Studio
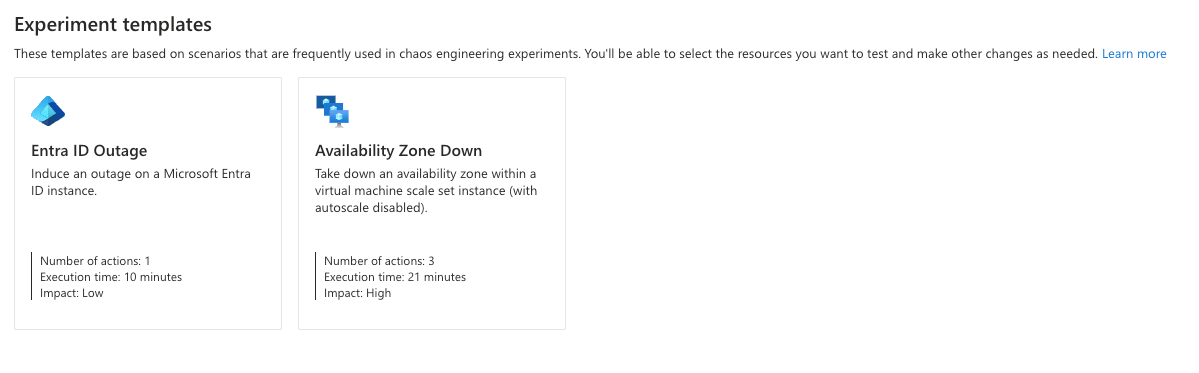
Azure Chaos Studio is Microsoft’s managed Chaos Engineering service, allowing teams to create controlled failure scenarios in a safe and repeatable manner. With fault injection capabilities across compute, networking, and application layers, teams can simulate real-world incidents and enhance their system’s resilience.
Key Features of Azure Chaos Studio:
- Agent-based and Service-based faults: Inject failures at the infrastructure or application level.
- Targeted chaos experiments: Apply disruptions to specific resources like VMs, AKS, or networking components.
- Integration with Azure Pipelines: Automate experiment execution within CI/CD workflows.
Automating Chaos Engineering with Terraform and Azure Pipelines
The repository https://github.com/geralexgr/ai-cloud-modern-workplace provides a ready-to-use automation pipeline that streamlines the deployment and execution of Chaos Engineering experiments.
Terraform for Experiment Setup
Terraform is used to define and deploy chaos experiments in Azure. The repository includes IaC (Infrastructure as Code) to:
- Provision Chaos Studio experiments.
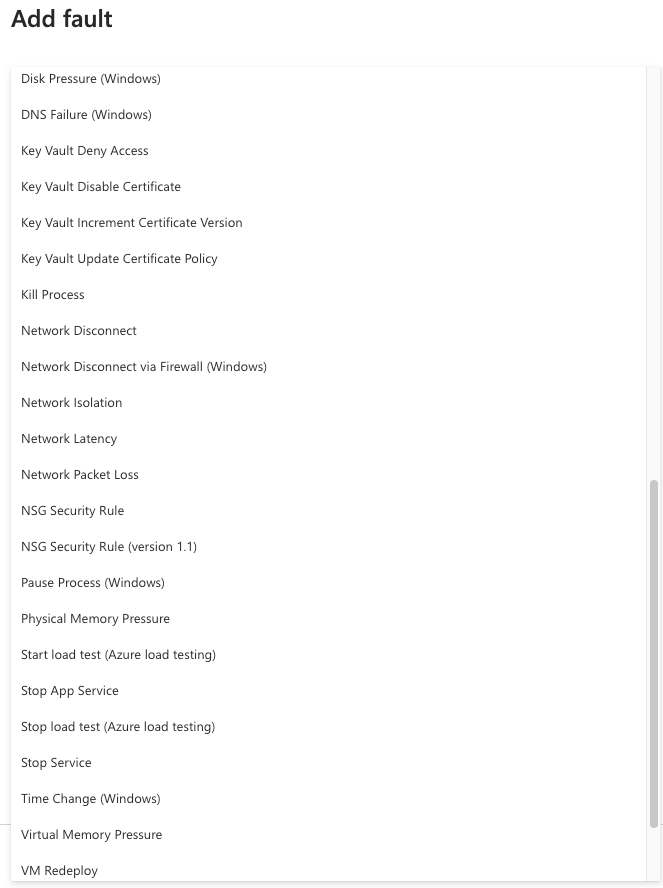
- Define failure scenarios (e.g., CPU stress, network latency, VM shutdowns).
- Assign experiments to specific Azure resources.
Using Terraform ensures that experiments are version-controlled, repeatable, and easily managed across different environments.
Azure DevOps Pipeline for Experiment Execution
A CI/CD pipeline is included in the repository to automate:
- Deployment of Chaos Experiments using Terraform.
- Execution of Chaos Tests within Azure Chaos Studio.
- Monitoring and reporting of experiment results.
This automation allows teams to integrate chaos testing into their release process, ensuring that new changes do not introduce unforeseen weaknesses.
Details
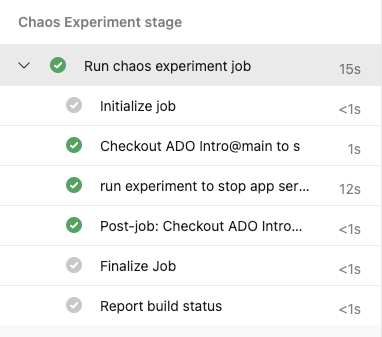
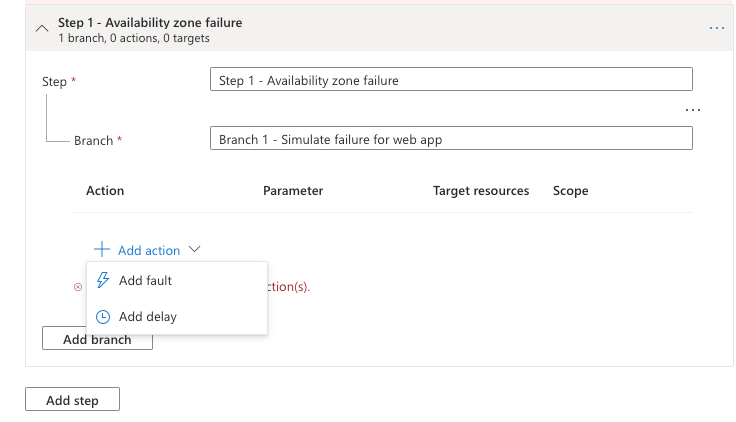
The pipeline consists of two stages. The first one creates the experiment through terraform and the second one will run the experiment that is created from the previous step.

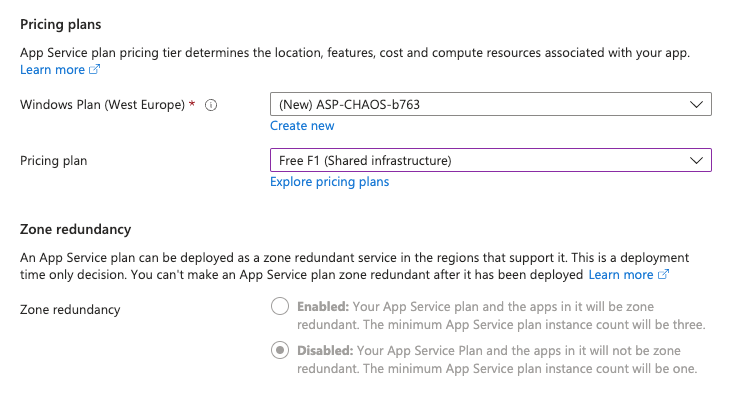
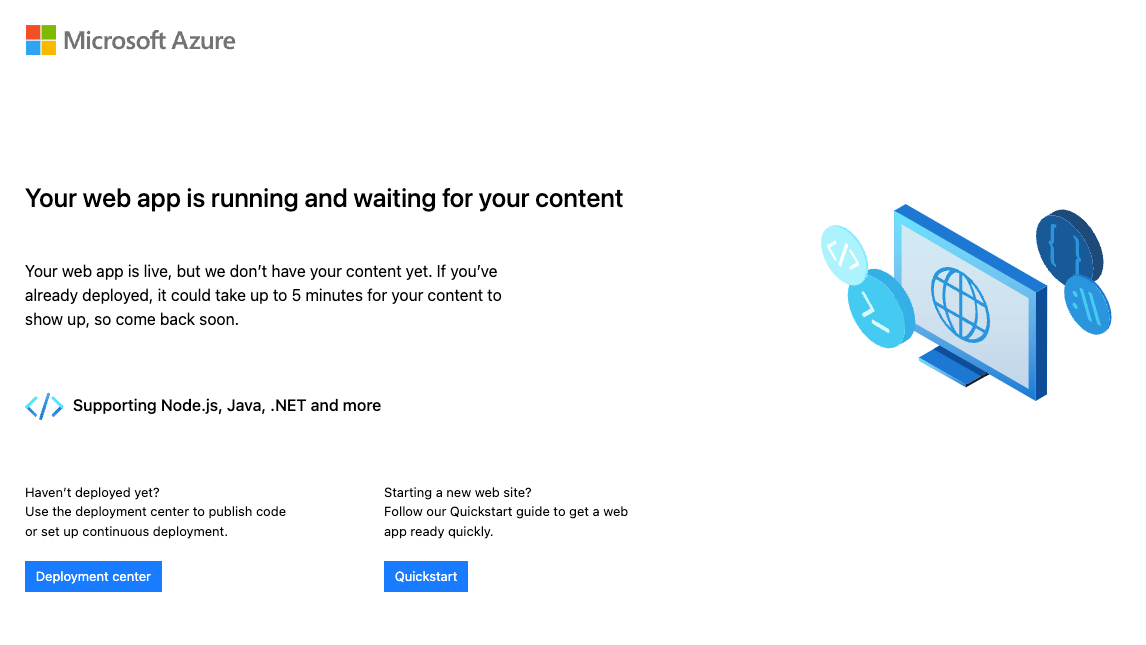
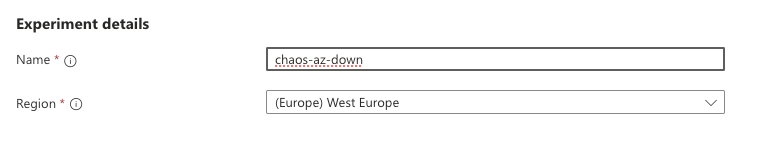
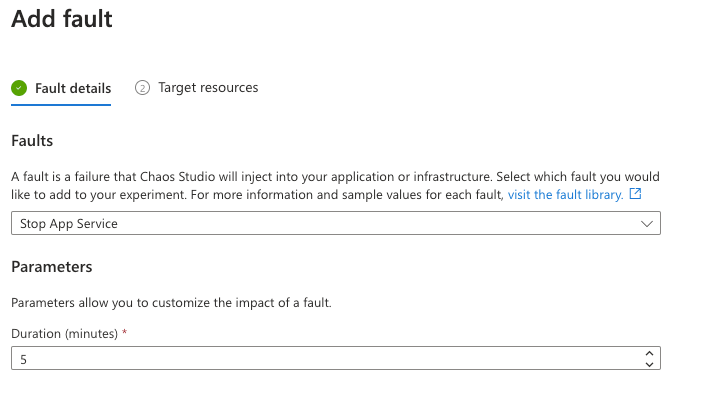
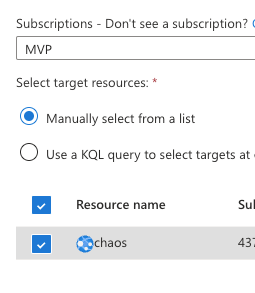
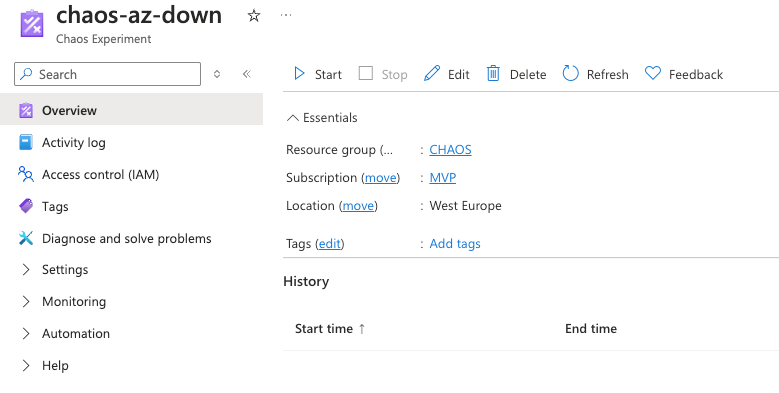
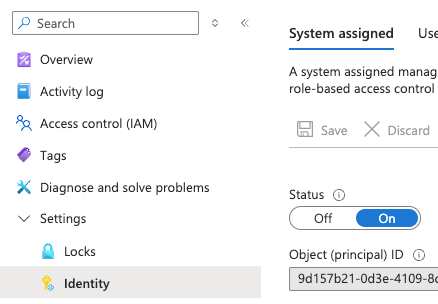
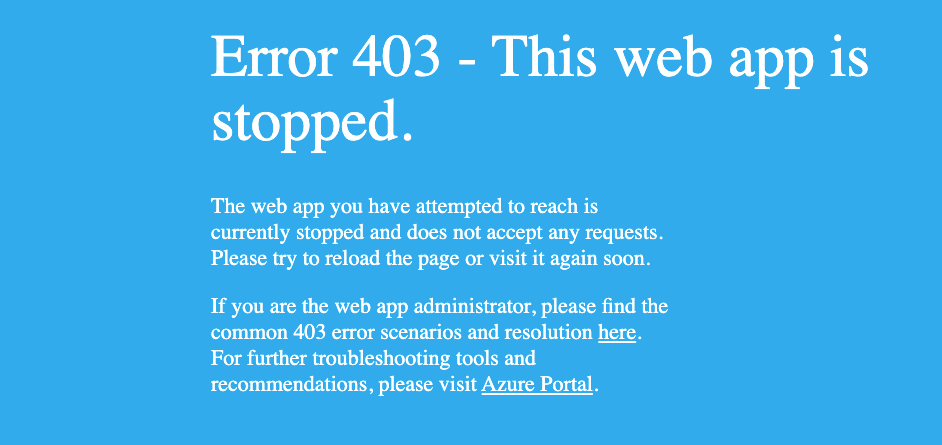
The experiment is designed to target a specific web app, identified via a variable, with the intended action of stopping it. A prerequisite in order to run the experiments would be to work with a user assigned managed identity and provide the necessary IAM actions on the identity.
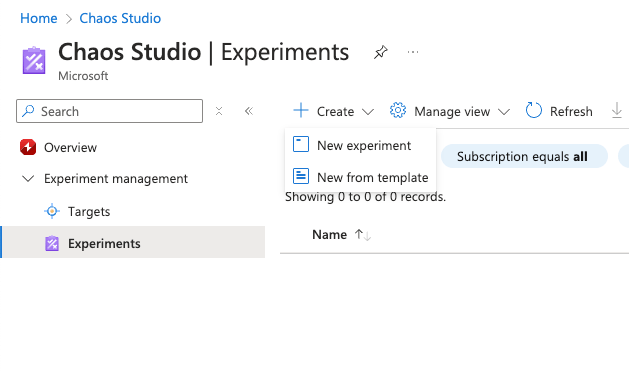
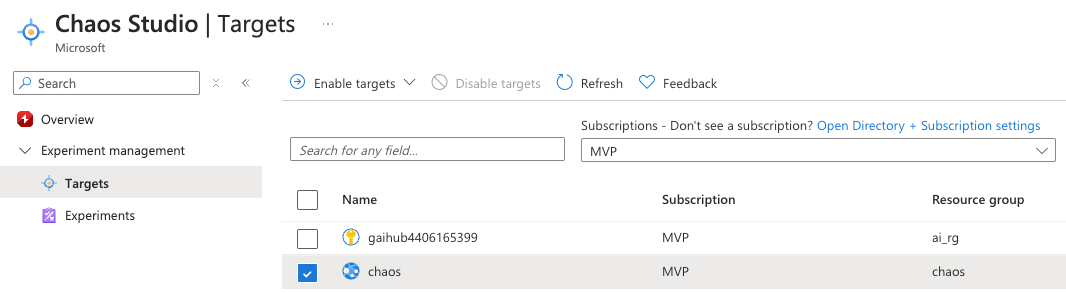
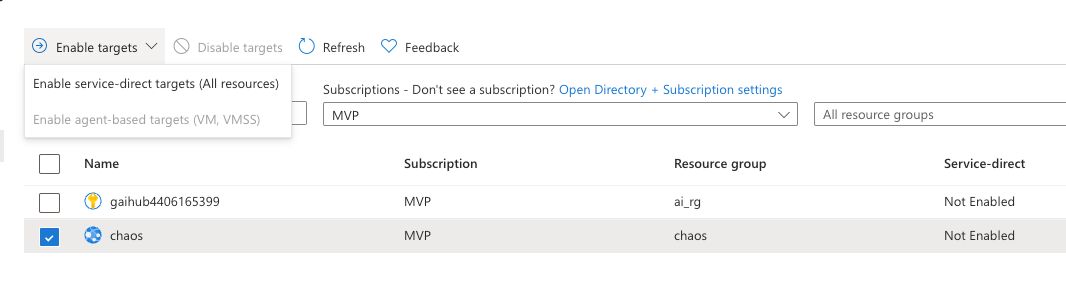
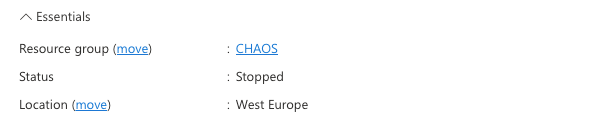
Finally you can find the result of the experiment on Azure inside Chaos Studio.

By combining Terraform, Azure Chaos Studio, and Azure Pipelines, you can automate and streamline Chaos Engineering in Azure. This approach helps identify system weaknesses early, improves system reliability, and ensures your cloud workloads can handle unexpected failures.